Default vs. spatial
To assess which modeling approach performs best we will use four different evaluation criteria. We will calculate the AUC (area under the receiver operating characteristic curve) and the MAE (mean absolute error) as proposed by Konowalik & Nosol (2021). Both metrics will be calculated on the spatially seperated test data from the presence records using the R package Metrics. As a third metric we will calculate the Boyce-Index (Boyce et al., 2002) using the R package ecospat with the prediction raster and the test data. To assess how complex the models are we will furthermore have a look at the number of parameters of each model. We will determine all four metrics for each combination of training and test data and calculate the median of all these values to get a comprehensive picture of the performance of each modeling approach.
We will start by calculating the metrics for each fold:
Median values for each species
Once we have the metrics for all combinations of training and test data we will calculate the median for each species using the script below. These are our final results.
To have a look at the final results and compare the modeling approaches with each other we will now plot the different metrics. The first plot shows for how many of the species which modeling approach provided the better results compared to the other modeling approach:
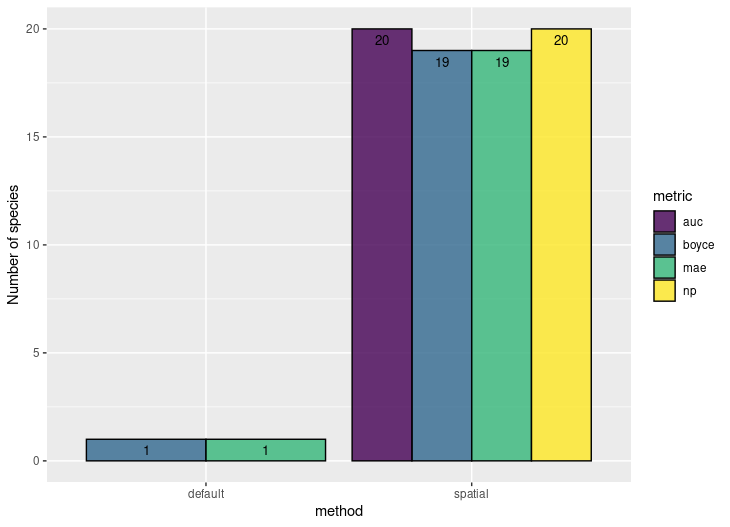
Figure: Number of species (y-axis) for which the maximum Boyce-Index, the maximum AUC value, the minimum MAE or the minimum number of parameters was measured. Sums up to 20 species for each metric.
The next plots are inspired by the plots proposed by Konowalik & Nosol (2021). Therefore we plot the MAE on the x-axis and the AUC and the Boyce-Index on the y-axis. The modeling approach that is closer to the upper right corner performed better.
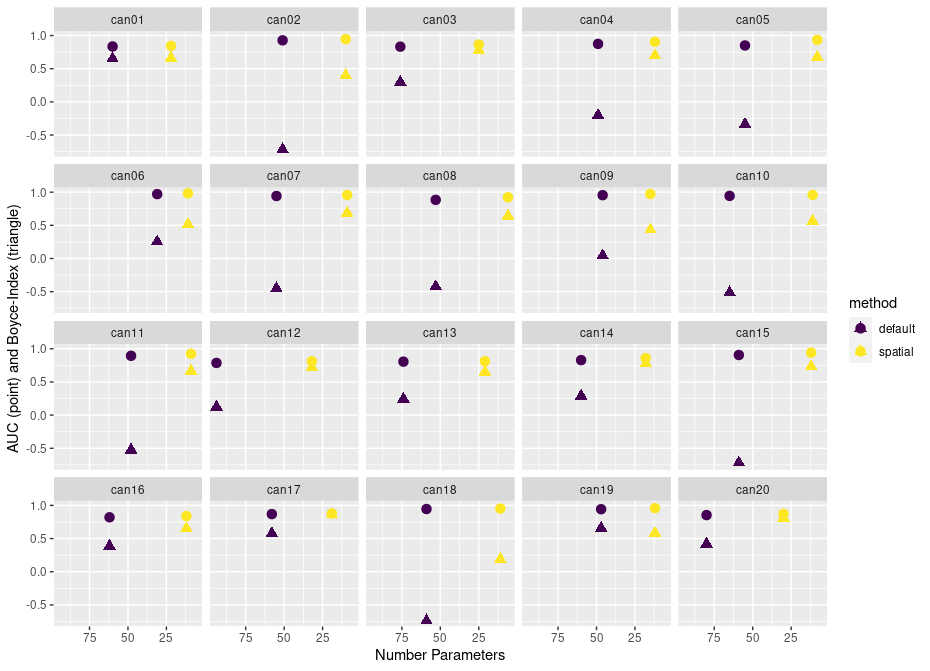 Figure: Results of region Ontario, Canada modeled with the modeling approaches spatial (yellow) and standard (purple). AUC (point) and Boyce-Index (triangle) on the y-axis and the MAE on the x-axis. For each Species the median value is given.
We repeat the same plots again this time with the number of parameters instead of the MAE on the x-axis. Again the modeling approach that is closer to the upper right corner performed better.
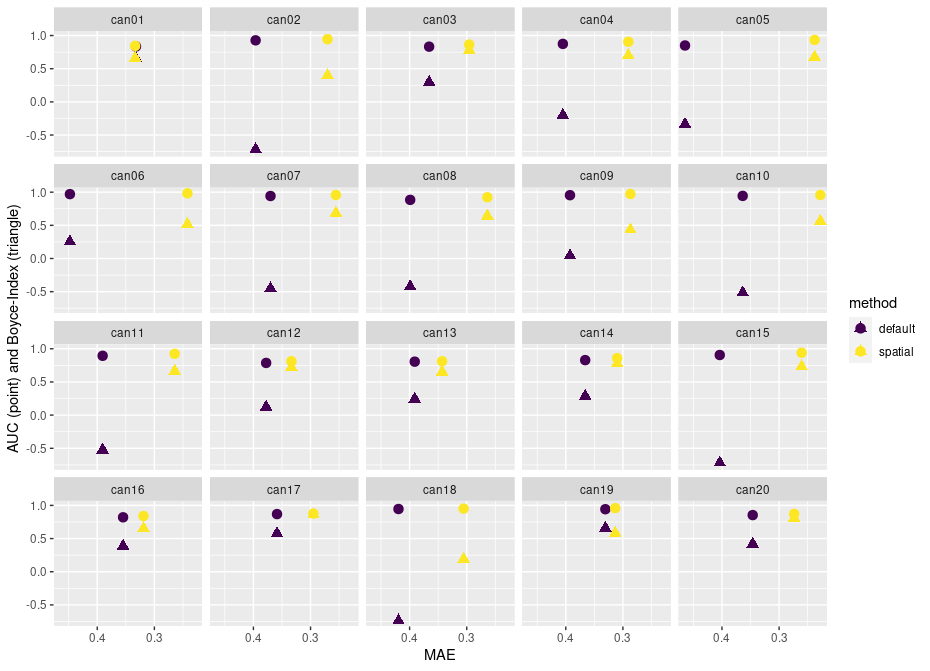 Figure: Results of region Ontario, Canada modeled with the methods spatial (yellow) and standard (purple). AUC (point) and Boyce-Index (triangle) on the y-axis and the Number of parameters on the x-axis. For each Species the median value is given.
It is also feasible to conduct an assessment of the influence of fine-tuning on response, as spatialMaxent produces response curve outcomes identical to Maxent. However, in this specific dataset, anonymization constraints prevent us from conducting this assessment here. Nonetheless, we encourage you to explore this aspect with your own non-anonymized data.